LaLiga: The data dashboards that are helping clubs to improve

Global audience metrics, digital engagement and macroeconomic data are some of the services being provided.
Data analysis is driving new business opportunities across the world and football is no exception. LaLiga’s business intelligence and analytics department has been working for the past two years to ensure the clubs in Spanish professional football have as much information as possible for analyzing the marketplace and making strategic business decisions. This initiative is set to expand thanks to a new range of club dashboards.
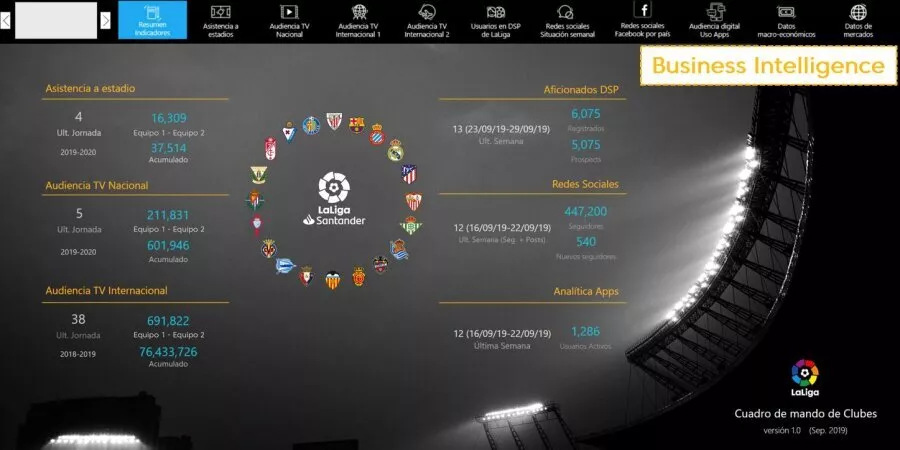
Released to clubs this season, the dashboards give club employees a world of data at their fingertips. Produced alongside the league’s international development department, they provide up-to-date information on various important metrics, from stadium attendances to TV audiences to social media stats to macroeconomic data from around the world.
[KH_ADWORDS type="4" align="center"][/KH_ADWORDS]“Thanks to these tools, clubs have a live snapshot of their market position and that of LaLiga in all countries,” said Óscar Mayo, head of LaLiga’s international development department. “This allows them to see their key performance indicators (KPIs) in each market and calculate where new growth opportunities may be found.”
The dashboards are a continuation of the digital ecosystem that LaLiga has created in recent years. All of the league’s digital assets (including websites, apps, social networks and the LaLigaSportsTV OTT platform) are combined with other sources of information (such as TV audiences and stadium attendance) in a centralized data lake where they are analyzed by LaLiga’s business intelligence and analytics department. Club dashboards have been built from this information, offering clubs simple ways to view and analyses the data.
[KH_ADWORDS type="2" align="center"][/KH_ADWORDS]Club by club analysis
To improve analysis, clubs can compare important data with averages from across the league. José Carlos Franco, director of technology and data at LaLiga, added: “The dashboards make it easier for clubs to analyse and compare their data using simple filters. This is helping clubs to improve their engagement on social networks and other campaigns in target markets.”
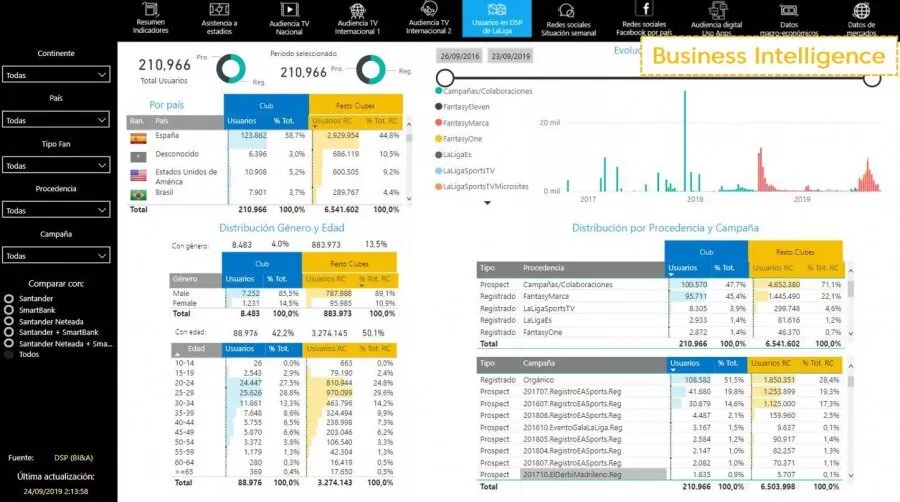
To help fine-tune campaigns, the dashboards offer demographic data of each club’s fans. Based on the users who have chosen a favorite club when accessing LaLiga’s digital platforms, clubs are provided with aggregate data on the age ranges, genders and countries of their fanbase and of the average fanbases of the other clubs in the league. Another example looks at social media followers per network, via a connection to the Blinkfire tool.
As Mayo detailed: “If a club has, for example, one or two players from Mexico and a major stake in that market then, thanks to this tool, they can check in real time if their growth in audience is significant, if their increase in social media followers from that country is above the average for the league’s clubs and if the market is one of interest or one with the possibility for growth.”
Using this data, clubs will be able to see the real impact of decisions they make and can better inform new investment decisions by showing more clearly where results are being generated.
[KH_ADWORDS type="3" align="center"][/KH_ADWORDS]Relevant data for all departments
As the dashboards are introduced to the clubs, all departments will have the opportunity to benefit. Stadium attendance data can help ticketing teams by working out their historical attendance data for a certain day of the week or kick-off time or opponent, TV audience data can show marketing where the club has the most fans tuning in to help them plan internationalization strategies and the detailed data on app usage can assist digital or IT departments to improve the service and cater to users’ needs.
“Already we are helping clubs to build personalized digital channels and start joint campaigns that apply data-driven marketing techniques,” Franco added.
LaLiga is now focused on ensuring the clubs know how to make the most of this wealth of information and has provided staff from its international development department and business intelligence and analytics department to help with this. “There is a general email address and people behind it who can help clubs with interpretation of data and any technical or business questions they might have,” Mayo stated.
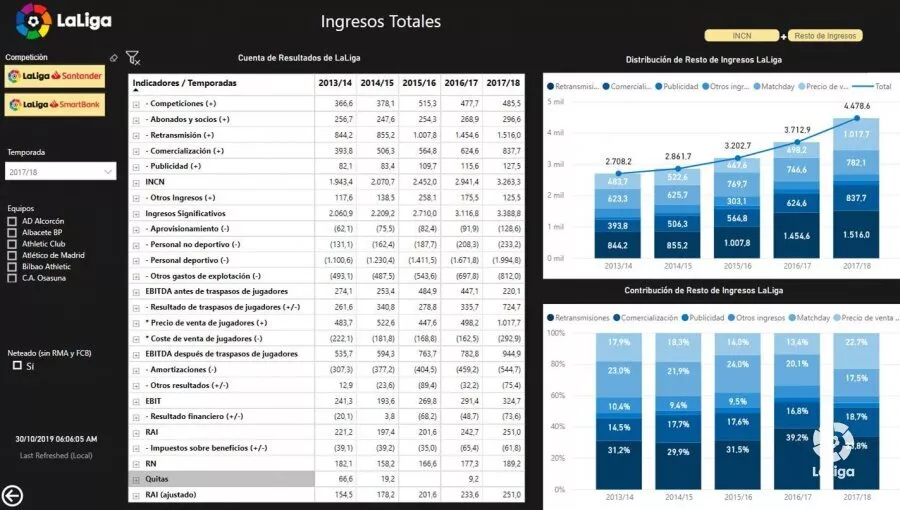
In addition to the data on the activities of the clubs and the league, there is also lots of external information that can be very helpful. Macroeconomic data from around the world, on metrics such as population, GDP and homes with a TV set, can help clubs to work out which countries and regions provide the best market opportunities. There is local consumer and business data provided by Ampere, with useful details such as average revenue per user and OTT popularity just a couple of clicks away.
While the clubs explore the new dashboards, LaLiga is already working on new ways to evolve them. “We need to keep adding data to this,” Mayo said. “The key is being able to provide as much information and market context as possible, whether external or based on the clubs themselves.”
[KH_RELATED_NEWS title="Related News | ARTICLE CONTINUES BELOW"][/KH_RELATED_NEWS]Some snapshots of the dashboard
Where passion meets insight — blending breaking news, in-depth strategic analysis, viral moments, and jaw-dropping plays into powerful sports content designed to entertain, inform, and keep you connected to your favorite teams and athletes. Expect daily updates, expert commentary and coverage that never leaves a fan behind.